Back
Colour Toss and Simple Graphing
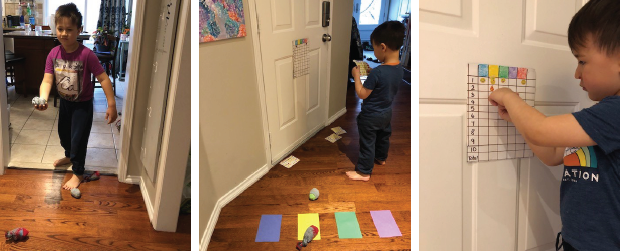
Similar to traditional bean bag toss, this activity is a fun way to practice colour recognition and counting while being active. Using coloured construction paper as the targets, toss a bean bag or a stuffed animal toward the targets. Whichever colour the item lands on, use a sticker to mark it on your graph. How far away should you stand from the target? You can create multiple starting points depending on the age and stage of your child(ren).
Materials for Activity:
- Coloured construction paper
- Bean bag or stuffed animals for tossing
- Tape
Materials to Make Your Own Bean Bags:
- Sandwich bags
- Socks
- Elastic bands
- Dried beans or rice (Lego pieces or puzzle pieces work too)
Making the Bean Bags:
Partially fill the sandwich bags with dried rice or beans, just put enough in to provide some weight. Then using tape, secure the bags at the opening. Then carefully place one bag into the bottom of a sock. Next, secure the sock with an elastic band. Make at least two bags, but you can make as many as you’d like!
Engaging Your Child:
This activity will strengthen your child's mind and body. It might be a good idea to first demonstrate how to toss the bean bag. Next, encourage your child to toss the item toward a target. “Try tossing it to one of those colours. Which one will it land on?” or pose a challenge, “Let’s try and land on the red paper. Which one is the red one?” It may be tricky to land the bean bag on the sheet of construction paper so keep encouraging your child, “Let’s try again and toss a bit harder.” or “Maybe we should move in a bit. Oh! You were very close!” Tip: For toddlers and preschoolers, don’t make it competitive. Just have fun and focus mainly on the actions (tossing) and the colours (red, blue, yellow, etc.).
Graphing:
For a more mathematic experience during this game, introduce graphing. Each time the item lands on a colour, mark it on the chart (see photo). Graphing will help organize your data - which target has been hit the least? The most? Graphing is a good visual way to experience quantity and number.
EarlyON